Sisseln
Nowadays, Sisseln is a topic that has captured the attention of many people around the world. Since its emergence, Sisseln has generated great interest and been the subject of debate in various circles. Over the years, Sisseln has proven to be relevant in various areas, from technology to politics, culture and society in general. As we continue to explore and analyze Sisseln, it is imperative to understand its impact on our daily lives and the world around us. In this article, we will delve into the importance of Sisseln and its influence on different aspects of contemporary society.
Sisseln | |
|---|---|
 Coat of arms | |
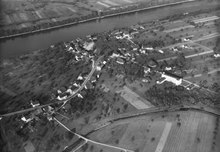
Location of Sisseln  | |
 Sisseln  Sisseln | |
| Coordinates: 47°33′N 7°59′E / 47.550°N 7.983°E | |
| Country | Switzerland |
| Canton | Aargau |
| District | Laufenburg |
| Area | |
| • Total | 2.52 km2 (0.97 sq mi) |
| Elevation | 295 m (968 ft) |
| Population | |
| • Total | 1,616 |
| • Density | 640/km2 (1,700/sq mi) |
| Time zone | UTC+01:00 (Central European Time) |
| • Summer (DST) | UTC+02:00 (Central European Summer Time) |
| Postal code(s) | 4334 |
| SFOS number | 4177 |
| ISO 3166 code | CH-AG |
| Surrounded by | Bad Säckingen (DE-BW), Eiken, Kaisten, Münchwilen, Murg (DE-BW), Stein |
| Website | www SFSO statistics |
Sisseln is a municipality in the district of Laufenburg in the canton of Aargau in Switzerland.
Geography
Sisseln has an area, as of 2009, of 2.52 square kilometers (0.97 sq mi). Of this area, 0.82 km2 (0.32 sq mi) or 32.5% is used for agricultural purposes, while 0.5 km2 (0.19 sq mi) or 19.8% is forested. Of the rest of the land, 0.89 km2 (0.34 sq mi) or 35.3% is settled (buildings or roads), 0.38 km2 (0.15 sq mi) or 15.1% is either rivers or lakes.
Of the built up area, industrial buildings made up 9.5% of the total area while housing and buildings made up 6.0% and transportation infrastructure made up 12.7%. Power and water infrastructure as well as other special developed areas made up 5.6% of the area while parks, green belts and sports fields made up 1.6%. Out of the forested land, 13.9% of the total land area is heavily forested and 6.0% is covered with orchards or small clusters of trees. Of the agricultural land, 27.4% is used for growing crops and 4.8% is pastures. All the water in the municipality is in rivers and streams.
Coat of arms
The blazon of the municipal coat of arms is Vert a Bend sinister wavy Argent and from it issuant towards base a Bendlet wavy and in chief a Trident of the same in bend downwards. The two wavy bars represent the Rhine River (the larger one) and the Sissle River (the smaller one)."
Demographics
Sisseln has a population (as of December 2020) of 1,661 As of June 2009, 17.0% of the population are foreign nationals. Over the last 10 years (1997–2007) the population has changed at a rate of 10.4%. Most of the population (as of 2000) speaks German (91.9%), with Italian being second most common ( 2.4%) and French being third ( 0.9%).
The age distribution, as of 2008, in Sisseln is; 149 children or 11.3% of the population are between 0 and 9 years old and 145 teenagers or 11.0% are between 10 and 19. Of the adult population, 142 people or 10.8% of the population are between 20 and 29 years old. 196 people or 14.9% are between 30 and 39, 252 people or 19.2% are between 40 and 49, and 199 people or 15.1% are between 50 and 59. The senior population distribution is 136 people or 10.3% of the population are between 60 and 69 years old, 65 people or 4.9% are between 70 and 79, there are 28 people or 2.1% who are between 80 and 89,and there are 3 people or 0.2% who are 90 and older.
As of 2000, there were 20 homes with 1 or 2 persons in the household, 248 homes with 3 or 4 persons in the household, and 241 homes with 5 or more persons in the household. As of 2000, there were 521 private households (homes and apartments) in the municipality, and an average of 2.4 persons per household. In 2008 there were 279 single family homes (or 46.4% of the total) out of a total of 601 homes and apartments. There were a total of 8 empty apartments for a 1.3% vacancy rate. As of 2007, the construction rate of new housing units was 8.1 new units per 1000 residents.
In the 2007 federal election the most popular party was the SVP which received 40.9% of the vote. The next three most popular parties were the CVP (20.1%), the SP (13%) and the FDP (11.1%).
In Sisseln about 74.1% of the population (between age 25-64) have completed either non-mandatory upper secondary education or additional higher education (either university or a Fachhochschule). Of the school age population (in the 2008/2009 school year), there are 123 students attending primary school in the municipality.
The historical population is given in the following table:
| Year | Pop. | ±% |
|---|---|---|
| 1975 | 608 | — |
| 1980 | 745 | +22.5% |
| 1990 | 1,182 | +58.7% |
| 2000 | 1,282 | +8.5% |
Economy
As of 2007, Sisseln had an unemployment rate of 2.16%. As of 2005, there were 12 people employed in the primary economic sector and about 4 businesses involved in this sector. 616 people are employed in the secondary sector and there are 18 businesses in this sector. 292 people are employed in the tertiary sector, with 39 businesses in this sector.
In 2000 there were 697 workers who lived in the municipality. Of these, 506 or about 72.6% of the residents worked outside Sisseln while 914 people commuted into the municipality for work. There were a total of 1,105 jobs (of at least 6 hours per week) in the municipality. Of the working population, 15.7% used public transportation to get to work, and 58.8% used a private car.
Religion
From the 2000 census, 563 or 44.7% were Roman Catholic, while 380 or 30.2% belonged to the Swiss Reformed Church. Of the rest of the population, there were 6 individuals (or about 0.48% of the population) who belonged to the Christian Catholic faith.
References
- ^ a b "Arealstatistik Standard - Gemeinden nach 4 Hauptbereichen". Federal Statistical Office. Retrieved 13 January 2019.
- ^ "Ständige Wohnbevölkerung nach Staatsangehörigkeitskategorie Geschlecht und Gemeinde; Provisorische Jahresergebnisse; 2018". Federal Statistical Office. 9 April 2019. Retrieved 11 April 2019.
- ^ a b Swiss Federal Statistical Office-Land Use Statistics 2009 data (in German) accessed 25 March 2010
- ^ Flags of the World.com accessed 10-May-2010
- ^ "Ständige und nichtständige Wohnbevölkerung nach institutionellen Gliederungen, Geburtsort und Staatsangehörigkeit". bfs.admin.ch (in German). Swiss Federal Statistical Office - STAT-TAB. 31 December 2020. Retrieved 21 September 2021.
- ^ Statistical Department of Canton Aargau -Bereich 01 -Bevölkerung (in German) accessed 20 January 2010
- ^ a b c d e f g Swiss Federal Statistical Office accessed 10-May-2010
- ^ a b Statistical Department of Canton Aargau -Bevölkerungsdaten für den Kanton Aargau und die Gemeinden (Archiv) (in German) accessed 20 January 2010
- ^ a b c Statistical Department of Canton Aargau - Aargauer Zahlen 2009 (in German) accessed 20 January 2010
- ^ a b Statistical Department of Canton Aargau (in German) accessed 20 January 2010
- ^ Statistical Department of Canton Aargau-Bereich 11 Verkehr und Nachrichtenwesen (in German) accessed 21 January 2010
| International | |
|---|---|
| Other | |